Projects
Open-Source Model of Famine in Sudan (2024)
I am deeply concerned about the ongoing famine in Sudan and fear the situation could worsen. To promote transparency and understanding, I developed an open-source reconstruction of the Clingendael Institute model of famine in Sudan (minor differences may exist due to the reconstruction but the conclusions are similar). Additionally, I performed a sensitivity analysis to explore how different inputs impact the model’s outcomes.
Resources:
- GitHub Repository - Model code and Jupyter Notebooks to run the analysis.
- Substack Post - Insights from coding and analyzing the famine model.
By making this model open-source, I hope to contribute to informed discussions and actions to address this humanitarian crisis. Please reach out if you have comments or suggestions!
Elenchos AI
I have consulted on various AI projects through Elenchos AI.
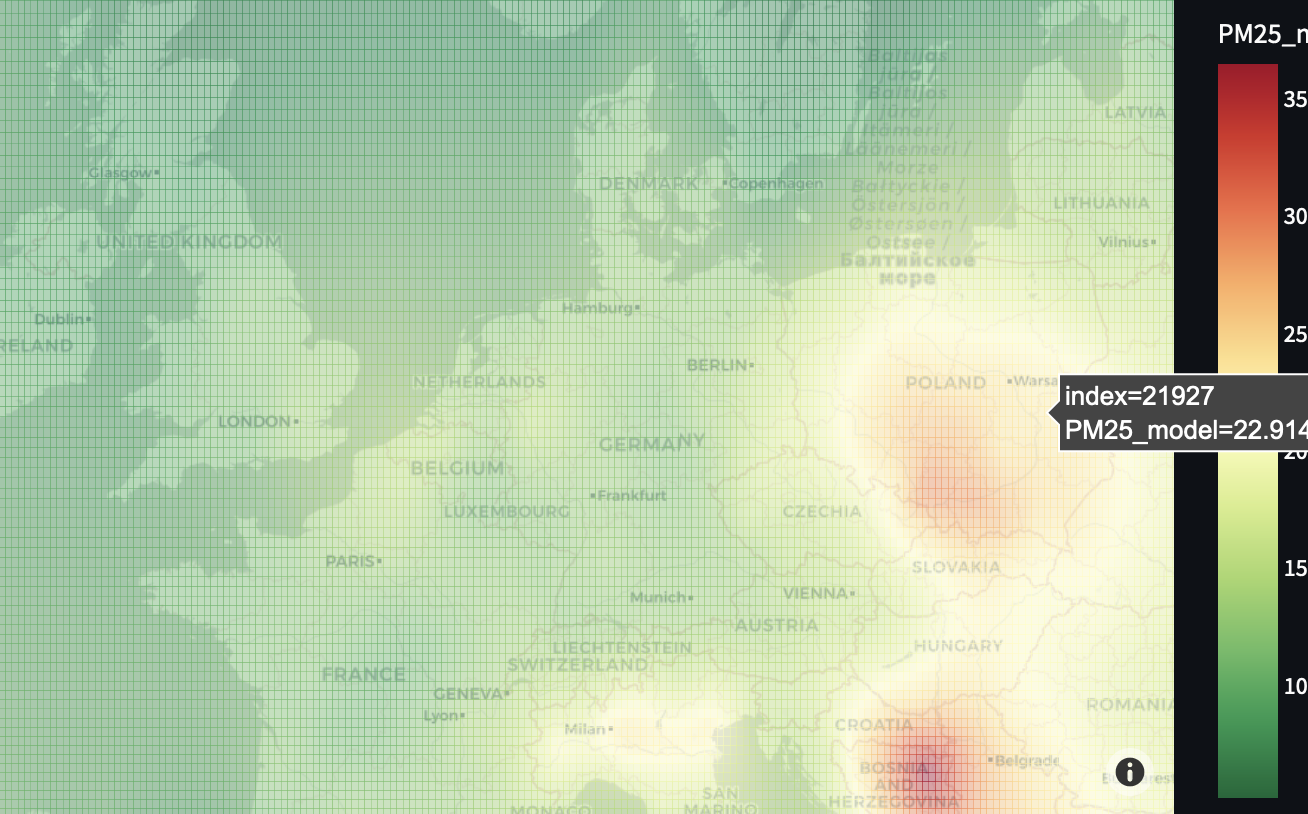
Geospatial Models of Air Pollution
I provide an interactive map to lookup locations and find the average value of PM2.5 based an ordinary kriging model of historical data from 2,356 sampling sites in continental Europe, 2010-2019. I also provide information on attributable mortality for the corresponding values of PM2.5.
Searchable map of PM2.5 and attributable mortality
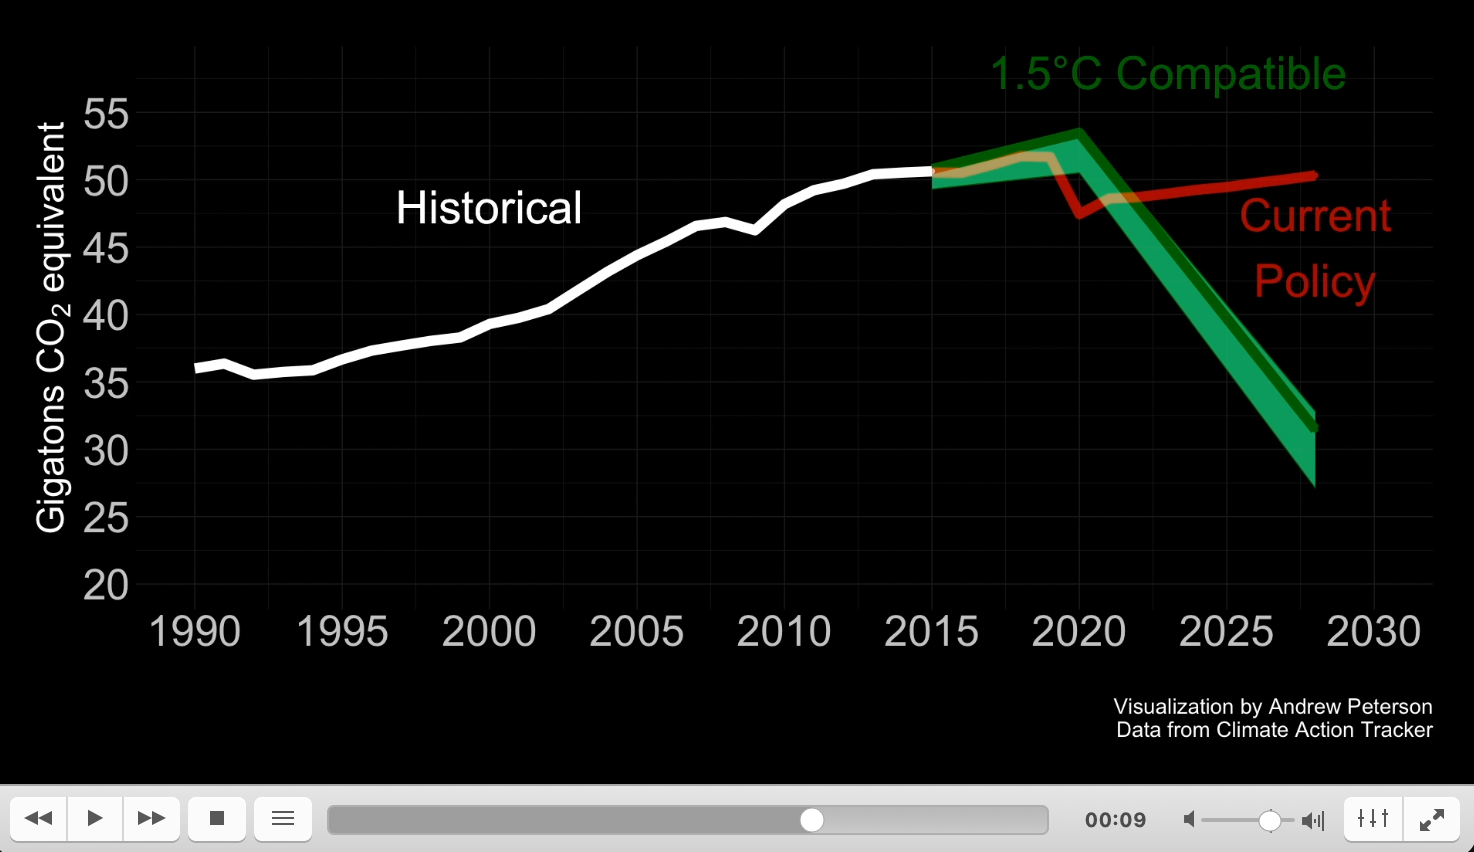
Visualizing Climate Change
Are we on track?
This animated plot compares the emissions trajectory required to keep global average temperature rise to 1.5 degrees versus the current path if proposed policies are enacted (based on Climate Action Tracker data, accessed May 2021). (code here)
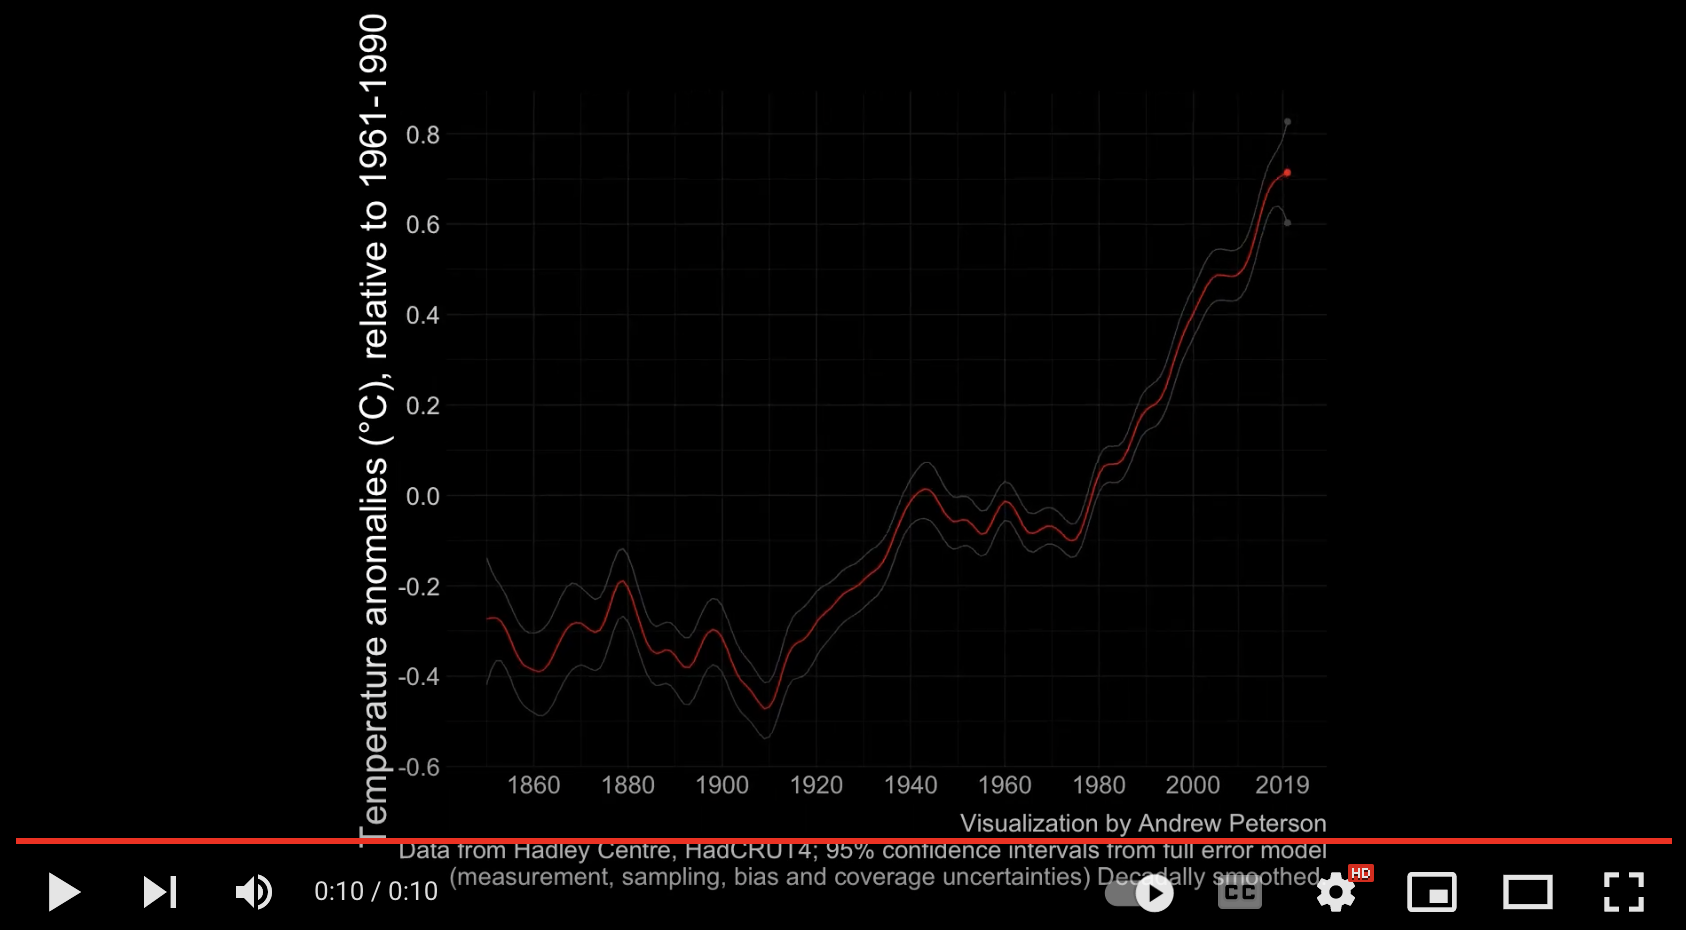
Global temperature anomalies
Animated graph of global average temperature anomalies, based on data from Morice, Colin P., et al. “Quantifying uncertainties in global and regional temperature change using an ensemble of observational estimates: The HadCRUT4 data set.” Journal of Geophysical Research: Atmospheres 117.D8 (2012).
Smart Climate Change Mitigation
A perhaps improbable vision for how to leverage differences in opinion about the correct path for climate change mitigation towards financing mitigation in the near term.
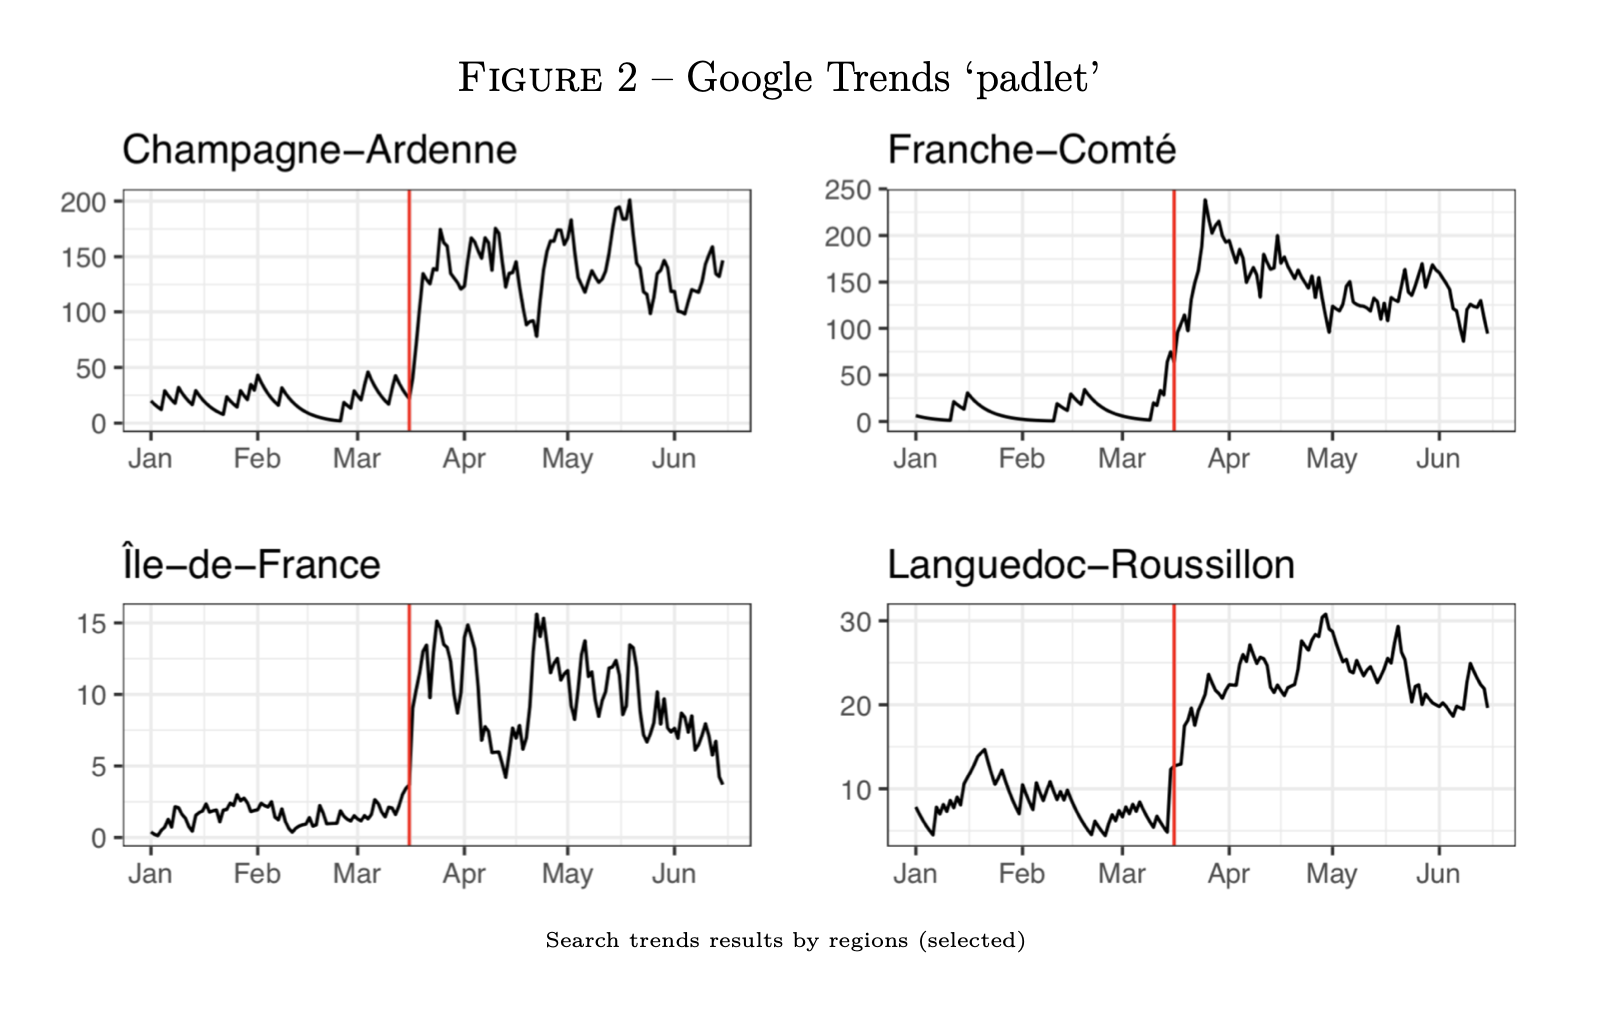
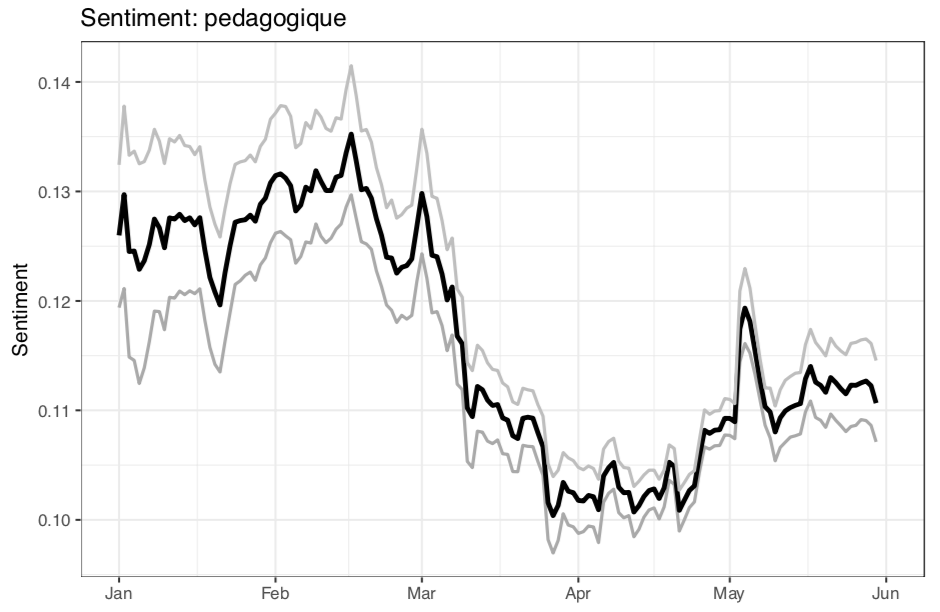
Analyzing Pedagogical Responses to Covid-19 Lockdowns
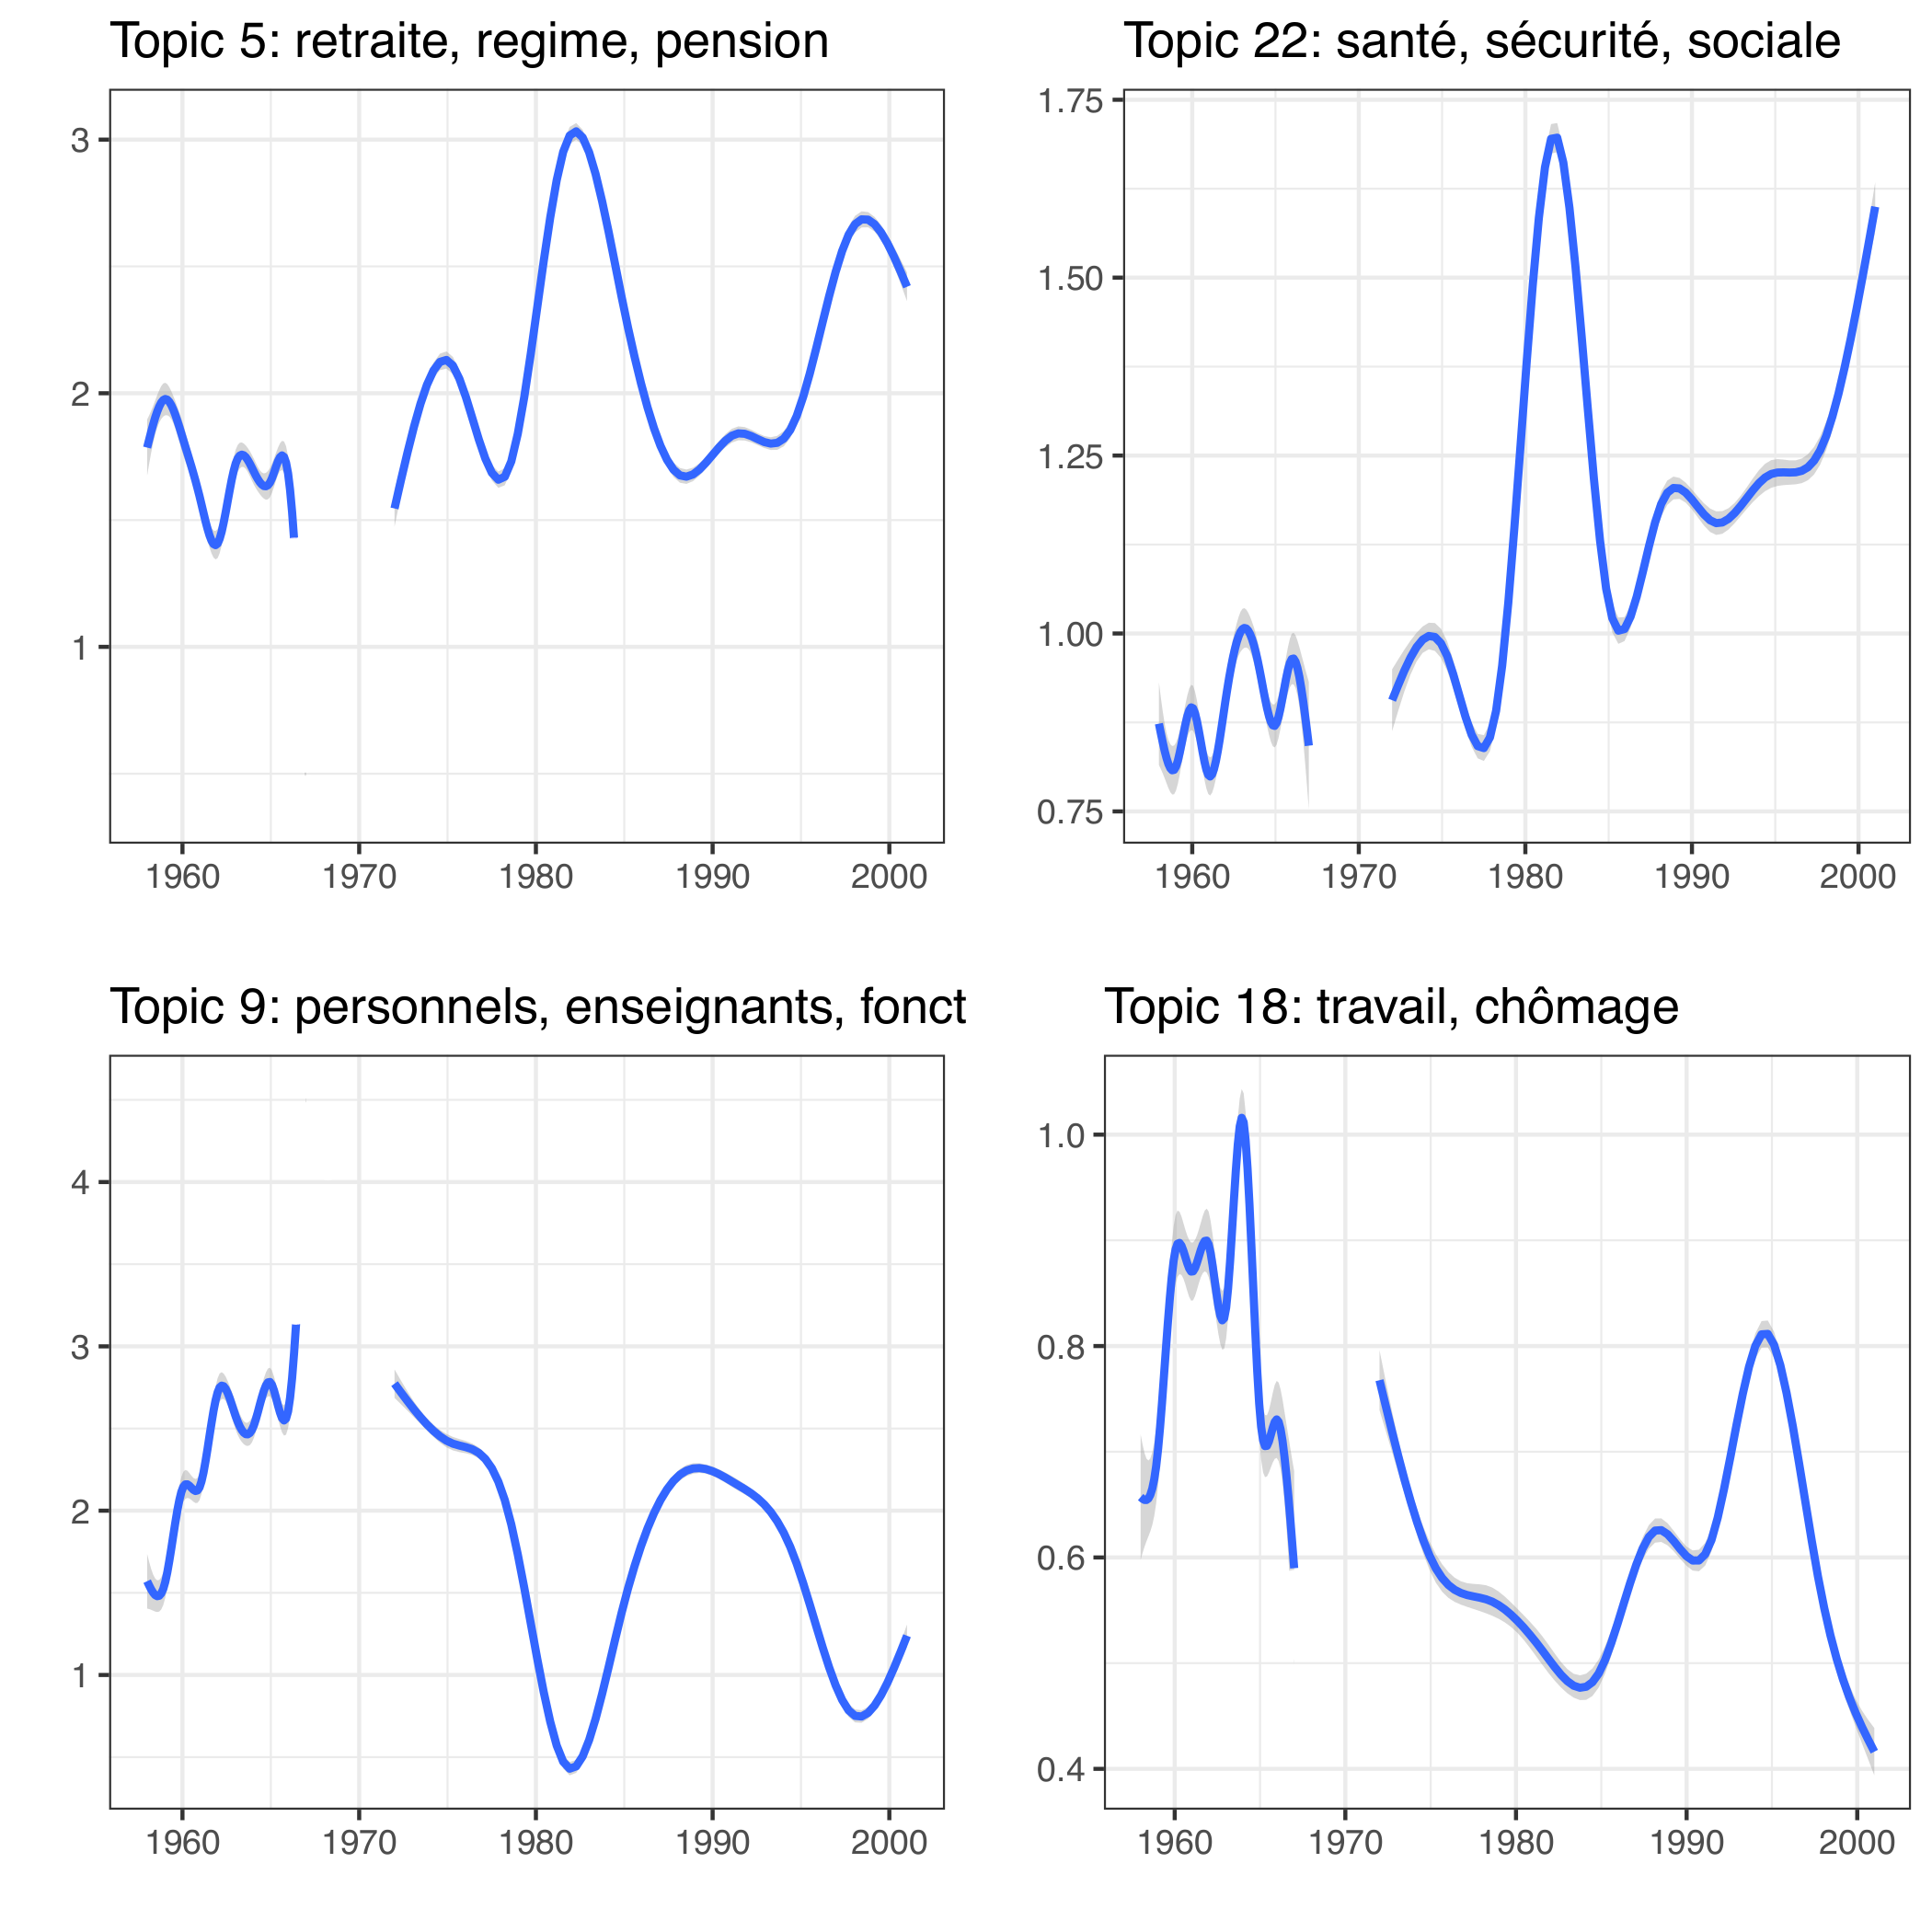
Topic Model of French Speeches
Analysis of French Parliamentary speeches using topic models (2019)
I apply a structured topic model to French Parliamentary speeches under the 5th Republic (up to the change in data format). While there is the usual arbitrariness in applying topic labels, it’s possible to identify key periods of Parliamentary discussion, such as surrounding reform of the health system (Topic 22).